
3.6. Debugging In Eclipse
3.6.1. Debugging In Eclipse
In this tutorial we will show basic debugging steps. To begin debugging a program, select the Debug mode by clicking the icon circled in blue below.
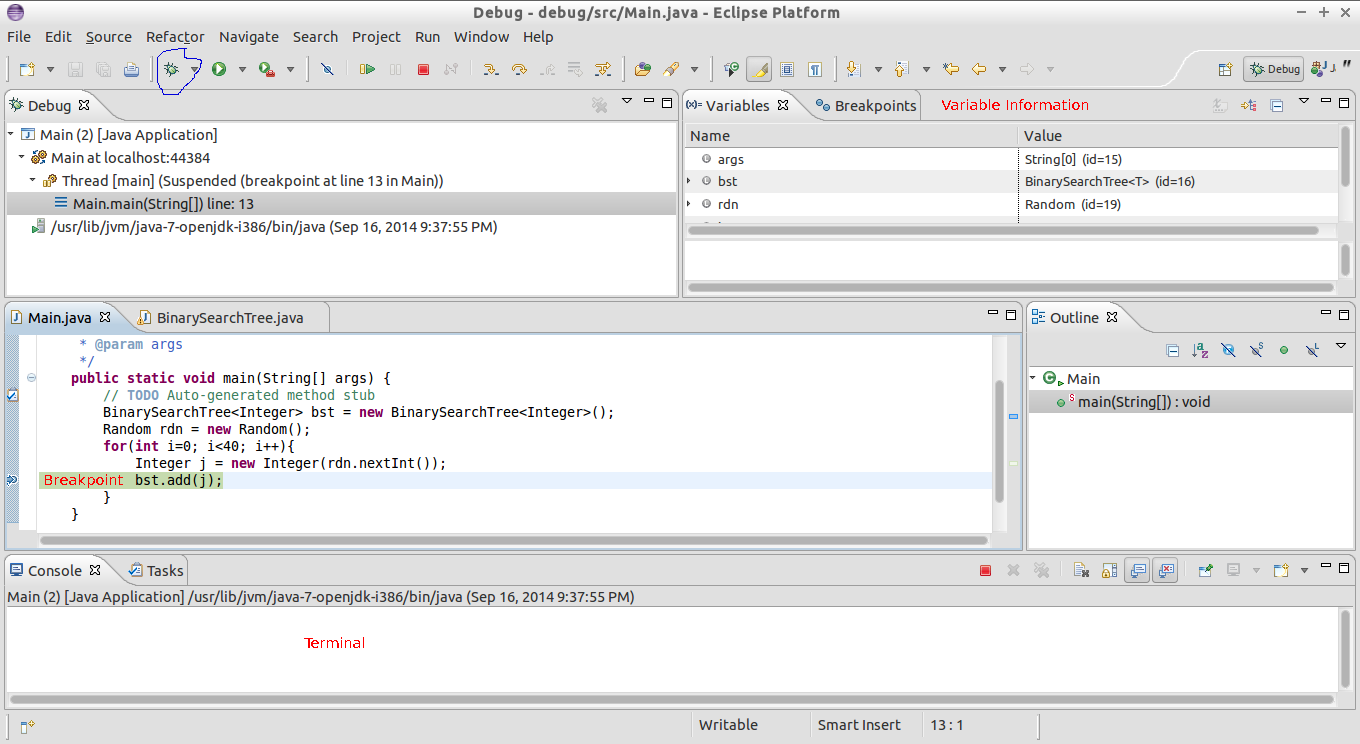
Figure 3.6.1: Figure 1
3.6.1.1. What Is A Debugger?
A debugger is a piece of software that allows a programmer to run their code as if it is executing normally, but allowing stops and pauses at any point to dump information from the program. It gives unprecendented knowledge to what happens in each step of the program. For more information about debuggers, refer to the Wikipedia entry.
3.6.1.2. Debugging Terms
1. Resume - Resuming will run the code until another breakpoint is hit or until the program finishes (see Figure 2 for icon).
2. Step Into - Stepping into will drop you into the next function called. For example, stepping into the bst.add() call in the above image will take you to the bst class and inside the add method (see Figure 2 for icon).
3. Step Over - Stepping Over will execute the current line of code and progress to the next line of code, stopping there (see Figure 2 for icon).
4. Step Return - Code will be executed until the next return statement (see Figure 2 for icon).
5. Breakpoint - A breakpoint is a stopping point in your code. When you set a breakpoint, the debugger will stop execution anytime it reaches there. You may add a breakpoint by clicking on the left hand side bar of the Eclipse code window (see Figure 1).

Figure 3.6.2: Figure 2
*Note - There are a few more step functions not documented here, you can learn more about them here.
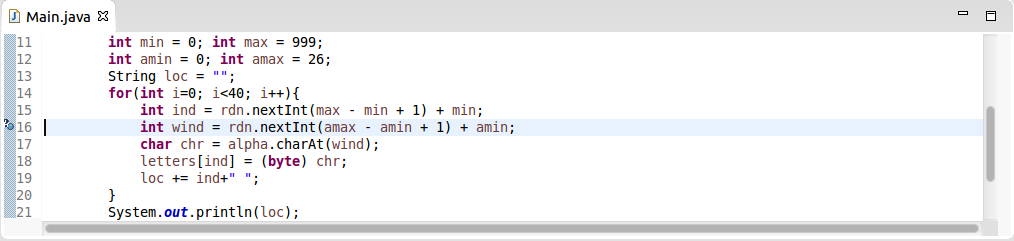
3.6.1.3. Debugging A Memory Pool
For some programs you may need to analyze byte chunks. In other words, for a region of memory, what does it represent and what information does it contain? Doing so can be difficult due to a combination of factors. So how do we meaningfully analyze a chunk of bytes? Consider the following code.
import java.util.Random;
public class Main {

   /**
    * @param args
    */
   public static void main(String[] args) {
      Random rdn = new Random();
      String alpha = "Zabcdefghijklmnopqrstuvwxyz";
      byte[] letters = new byte[1000];
       int min = 0; int max = 999;
       int amin = 0; int amax = 26;
       String loc = "";
      for(int i=0; i<40; i++) {
         int ind = rdn.nextInt(max - min + 1) + min;
         int wind = rdn.nextInt(amax - amin + 1) + amin;
         char chr = alpha.charAt(wind);
         letters[ind] = (byte) chr;
         loc += ind+" ";
      }
      System.out.println(loc);
   }

}
This program spawns a 1000 byte array and then places 1 of 27 characters chosen randomly in a position randomly chosen in one of the 1000 places. Suppose you wanted to look at the contents of the byte array. How would you do this? Eclipse let’s do it with a memory dump in the variable window (shown in Figure 1).
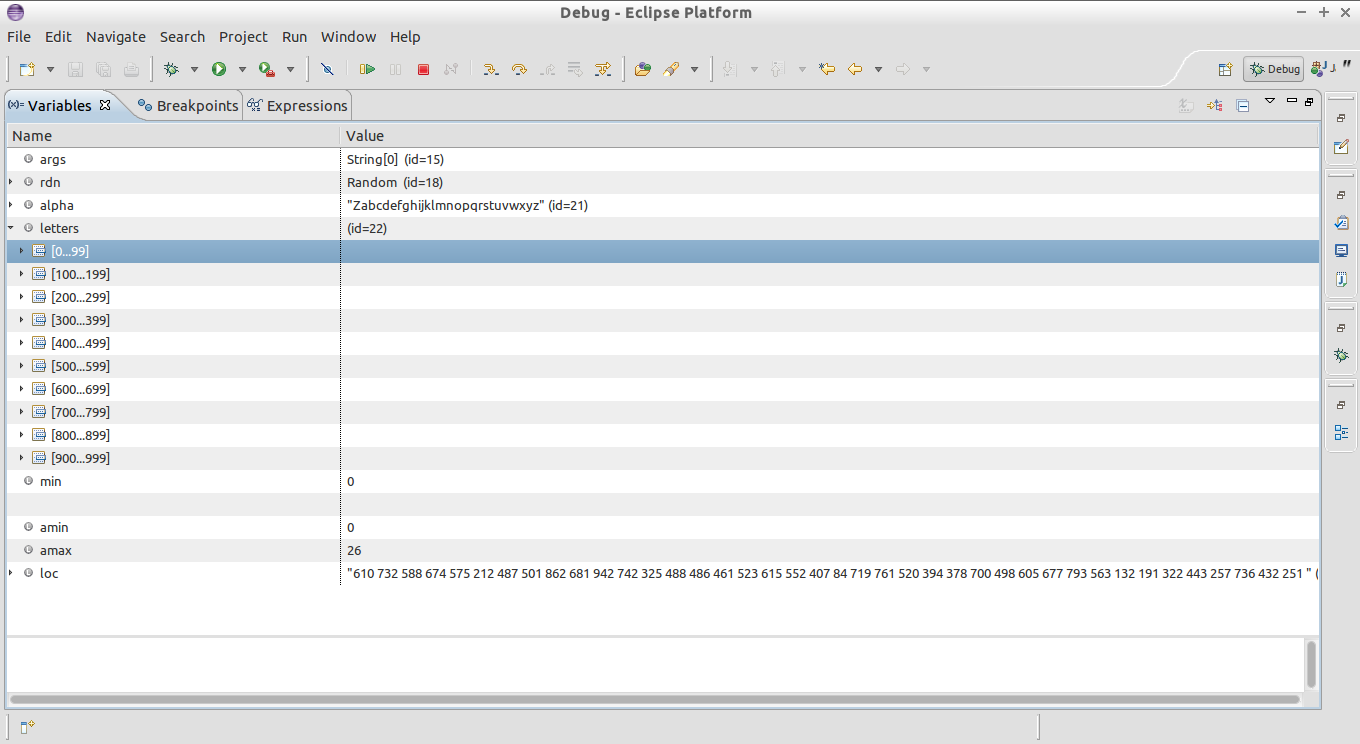
Figure 3.6.3: Figure 3
By default Eclipse will interpret a byte as an integer.

Figure 3.6.4: Figure 4
However there are a number of other ways to interpret byte values the information. You can open the Preferences window by selecting Window->Preferences (see Figure 5). Then you will be able to select the raw dump information. In this case I chose ASCII text so I can see the byte values interpreted as ASCII characters.
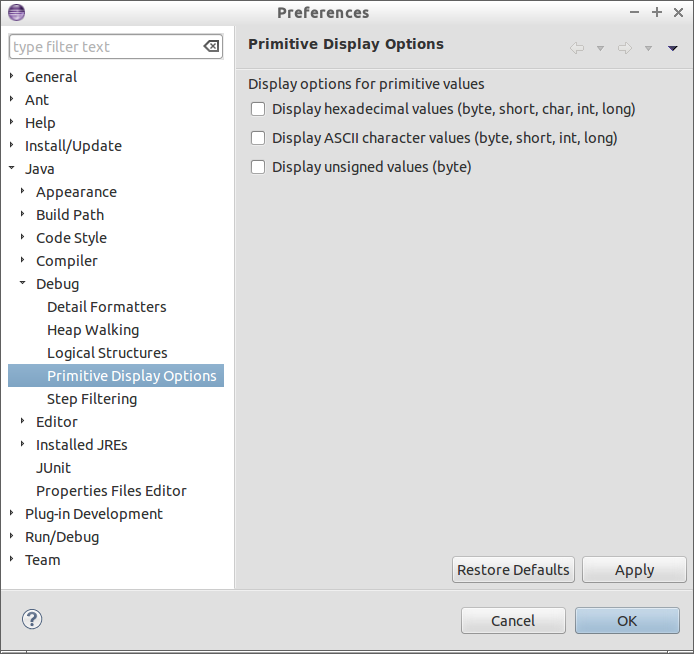
Figure 3.6.5: Figure 5
Now when we view the memory location we can see the character stored there. We can also change our display preferences to see the hex value or the unsigned value as well.

Figure 3.6.6: Figure 6: ASCII Text View Enabled

Figure 3.6.7: Figure 7: Hex View Enabled

Figure 3.6.8: Figure 8: Unsigned View Enabled

Figure 3.6.9: Figure 9: All Three Views Enabled
3.6.1.4. The Eclipse Console
So you can now view memory, set breakpoints and even step through functions to
the points you care about. gdb’s command line interface is very handy for dumping
information quickly and programmatically when debugging C programs.
Eclipse has a similar functionality. Eclipse’s Debug Shell
window is a debug terminal. If the Debug Shell window is not visible you can
enable it using Window->Show View->Debug Shell. Once the Debug Shell window is open
you can turn on autocomplete by right clicking and selecting Content Assist, or
by hitting CTRL-SPACE (similar to the completion assist Eclipse provides for coding).
The Debug Shell window allows you to write Java code and then execute it. It is a live
window where you can write code, execute methods and demo code without having to
recompile. Anytime you pause your program, you may access local variables,
change them, and print information out about them. In the below example
I have chosen to print the String args[0] (from the main() method from a command line program)
out to the output. While this particular example may not initially appear useful , imagine you are debugging a program.
You know a bug occurs, now instead of stopping and
recompiling your program with bug changes, you can rapidly prototype
your replacement code and test it on the spot to insure success.
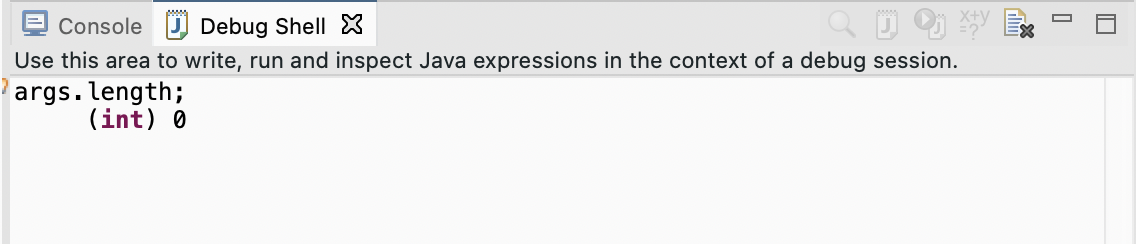
Figure 3.6.10: Figure 9: The Debug Shell
3.6.1.5. Conditional Breakpoints
Sometimes your bug might appear after a lot of processing. you cannot just set a breakpoint to a line of code, because that line is executed 10,000 times before the bug occurs. What you really want is to stop at a line only when some other condition (i.e. a variable being a certain value, or after X amount of times) is true. However adding in additional code to catch those specified conditions can lead to issues later if you forget to remove the additional code. Fortunately many debuggers have the functionality to only stop at breakpoints when needed.
Step 1: Create a breakpoint. For this example I will be using the source code from the memory pool that is randomly filled with characters. I want to hit my breakpoint if and only if the value of ind is 10.
Step 2: Right click on the breakpoint and select Breakpoint Properties
Step 3: You will then be presented with a screen similar to the picture below. There are two option to halt at a breakpoint: by hitcount and when a condition is satisfied. For this example I have chosen to stop my program only when the randomly generated index is equal to 10. Choose the option you would like, if you choose conditional, create an arbitrary boolean expression to satisfy.
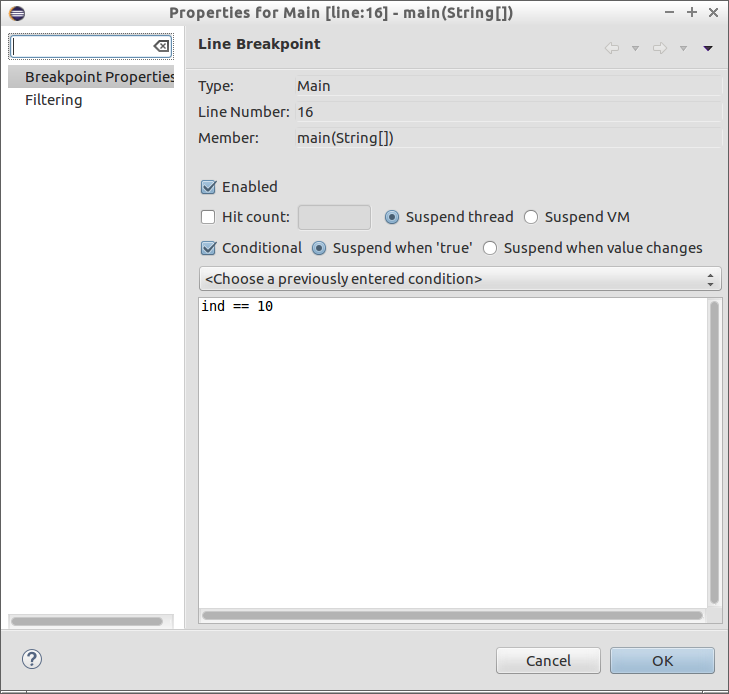
By making use of conditional breakpoints you can speed up debugging and eliminate the chance of accidentally progressing too far. For more information on using breakpoints, check out Eclipse's official documentation.